Hotel operations
How to compare consumption across hotel properties
Compare hotel consumption using consistent periods and units. Separate totals, occupancy and operating differences before deciding where to act.
The starting point
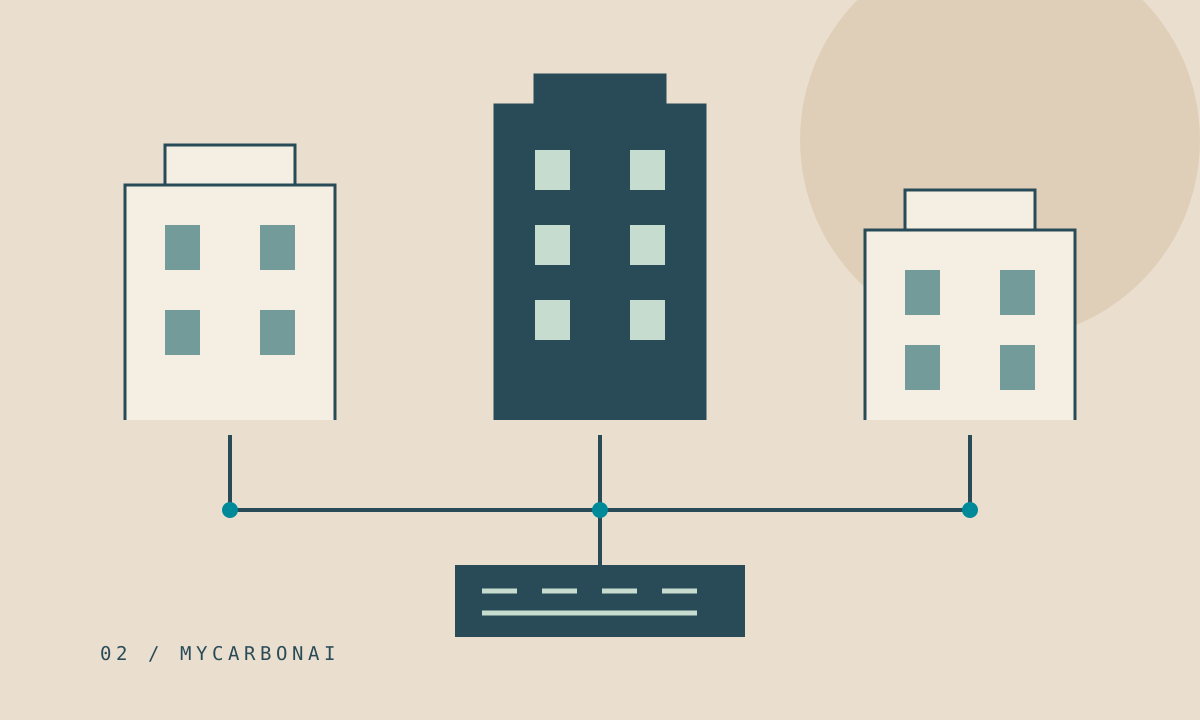
Useful comparisons require equivalent periods, consistent units and operating context. Show total consumption alongside the relative indicator.
1. Agree a shared collection format
Properties in a hotel group may have different suppliers, contracts and recording habits. Align the meaning of each field before comparing results. Monthly electricity totals should not mix meter readings with consumption inferred from cost.
Use a shared format: property, period, source, quantity, unit and review status. Assign a local owner and someone to consolidate the records. Agree a closing date and a process for corrections received afterwards.
2. Record the differences between properties
A hotel with an on-site laundry has a different operating profile from one that outsources it. Heated pools, restaurants, meeting areas, construction and closures can also change consumption. Record these features before ranking properties.
Turismo de Portugal’s accommodation environmental performance survey covers areas including energy, water and waste. It is a useful reference for organising topics, but sector-wide results are not automatically suitable targets for an individual property.
- Activities included within each property’s meters.
- Opening days and relevant operational changes.
- Occupancy definition and the source of denominator data.
- Gaps, estimates and supplier or equipment changes.
3. Show totals and relative indicators together
Absolute consumption describes how much was used. A figure per occupied room or per guest-night adds activity context, but these denominators are different. Choose one, define it and keep that definition consistent.
Illustrative example: 20,000 kWh divided by 1,000 occupied room-nights gives 20 kWh per occupied room-night. If occupancy rises while total consumption stays constant, the indicator falls without proving that equipment became more efficient. Show both values and explain changes.
4. Investigate changes before taking action
When a figure changes, check the data first: is an invoice missing, has an adjustment arrived, or did the period change? Then check operating conditions. Only after that should the observation become a hypothesis for the maintenance team to investigate.
End the monthly review with an action, an owner and a review date. For example, confirm whether a rise matches longer pool operating hours and check equipment schedules. Do not attribute savings to an intervention without a documented comparison.
References and further reading
Original editorial guidance from MyCarbonAI. Numerical examples are illustrative. This guide does not certify environmental performance.
What is missing from your hotel’s data?
Map the gaps with our ten-question checklist before starting the next report.
Open checklistDiscuss your data with us